
Do you feel confident, punk?
A solid hypothesis, a power analysis, and statistical significance: the holy trinity of A/B testing.
A solid hypothesis bases your proposed change on insight, keeping you honest and grounding your experiment in quantitative or qualitative data. A power analysis gives you the minimum sample size required to be reasonably confident of identifying a change and minimising inherent statistical errors. Statistical significance helps you understand how compelling your experimental data is and whether you can reject the null hypothesis.
The result of an experiment is statistically significant if it is unlikely to occur by chance alone. By unlikely we mean that the p-value (which is calculated from the measured experimental data) is less than a threshold we define before the experiment begins, usually 5%. If the p-value is less than 5% there is less than a 5% probability that the observed difference between A and B is due to chance. These odds are conventionally accepted to be ?good enough? to reject the null hypothesis and accept the B variant.
There are many online tools to calculate the p-value. However, when you are exporting data from Google Analytics or Mixpanel it becomes very repetitive entering the numbers manually into online calculators. Particularly if you are doing multiple calculations. So I made an Excel sheet that calculates the two-tailed p-value. You can download this for free from ExperimentationHub.com. It has a template based on GA/Mixpanel exports with a single cell formula for calculating the p-value that you can copy into your experiment analysis Excel sheet.
This is the formula:
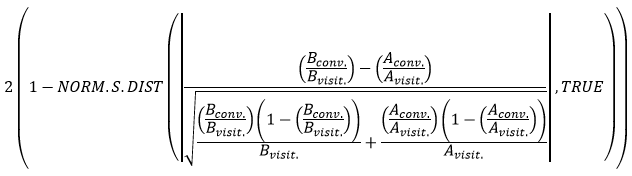
Where conv. is the number of conversions and visit. is the number of visitors (or sessions) for variant A or B. NORM.S.DIST is an Excel function that returns the standard normal distribution.
For this spreadsheet configuration:
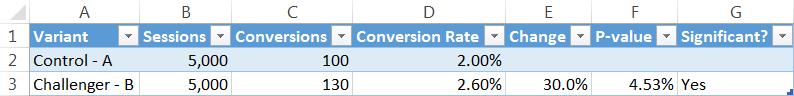
The p-value formula looks like this:
![]()
Or just download the Excel sheet and get analysing 🙂
Want to improve your A/B tests?
Check out my new site: ExperimentationHub.com for free tools and advice to help you run better experiments and become more confident in your results.
 ExperimentationHub.com
