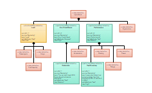
The Unified Modeling Language is a standardized general-purpose modeling language and nowadays is managed as a de facto industry standard by the Object Management Group (OMG). UML includes a set of graphic notation techniques to create visual models for software-intensive systems.
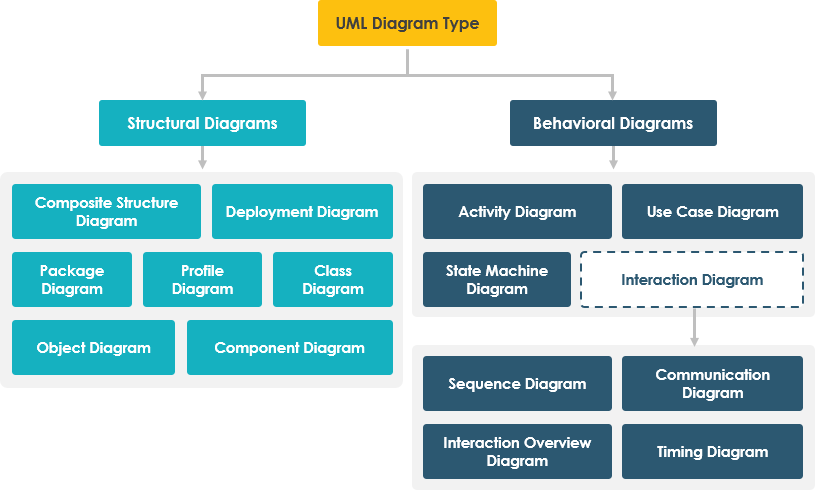
In UML 2.2 there are 14 types of UML diagrams, which are divided into two categories:
- 7 diagram types represent structural information
- Another 7 represent general UML diagram types for behavioral modeling, including four that represent different aspects of interactions.
These diagrams can be categorized hierarchically as shown in the following UML diagram map:
Question: UML is Huge and Complex?
UML is a truly a huge topic. UML provides a large volume of diagramming notation grouped into 14 different UML diagram types, each with different UML models, serving different purposes and addressing different aspects of development needs.
- Each UML diagram of the 14 UML diagram types provides a large set of constructs and notation that cover different needs for most of the software development projects.
- UML specification has more than 700 pages, and clearly considered as too complex and has a negative impact on the perception and adoption of UML.
- Typically, users tend to consider and use only a portion of its diagrams/constructs of UML.
Answer: Learn the Most Essential UML Diagrams and Notation
Grady Booch, one of the most important developer of Unified Modeling Language, stated that ?For 80% of all software only 20% of UML is needed?.
What is the UML Survey* States?
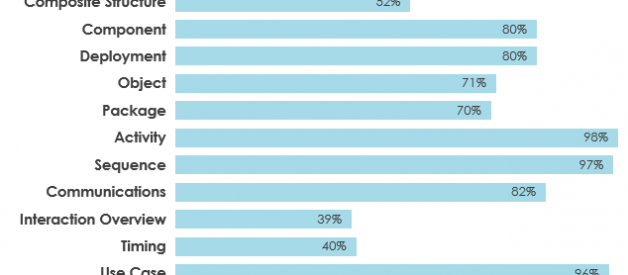
We could interpret the results of the UML survey by assuming that, if a diagram is
- widely used, if it ? 60% of the sources
- scarcely used if it is ? 40% of the sources
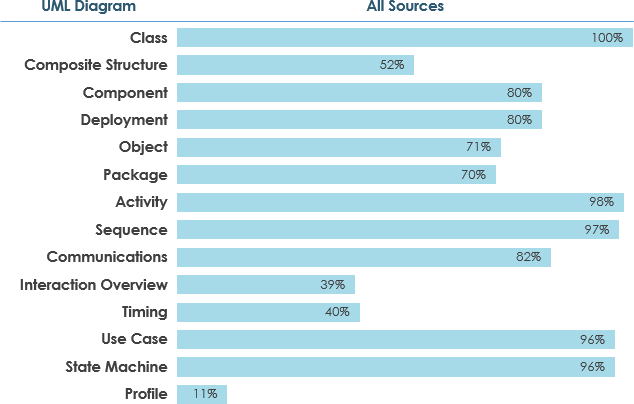
In this Article, I introduce all 14 types of UML diagrams according to the order of its? frequency of usage mentioned above:
For example, Class diagram is the most widely used one, so it will be discussed first in this section and so on?
Class Diagram
In software engineering, a class diagram in the Unified Modeling Language (UML) is a type of static structure diagram that describes the structure of a system by showing the system?s classes, their attributes, operations (or methods), and the relationships among objects.
Purpose of Class Diagrams
- Shows static structure of classifiers in a system
- Diagram provides a basic notation for other structure diagrams prescribed by UML
- Helpful for developers and other team members too
- Business Analysts can use class diagrams to model systems from a business perspective
A UML class diagram is made up of:
- A set of classes and
- A set of relationships between classes
Class Diagram ? Diagram Tool Example
A class diagram may also have notes attached to classes or relationships. Notes are shown in grey.
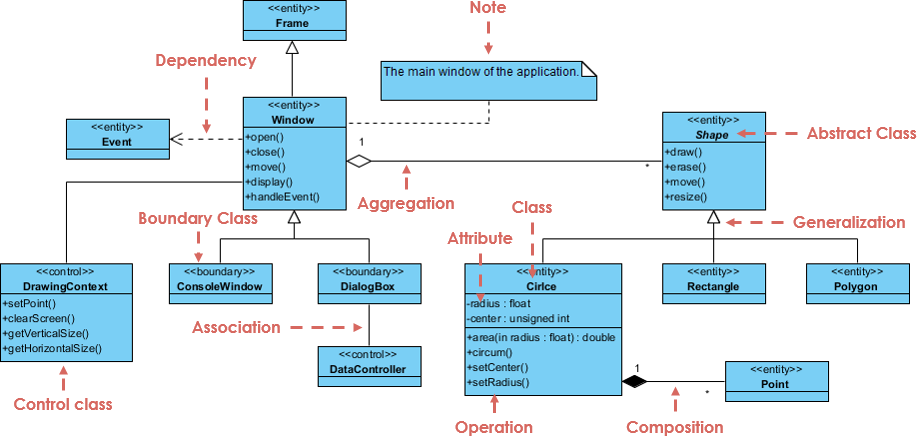
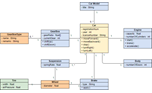
In the example above:
We can interpret the meaning of the above class diagram by reading through the points as following.
- Shape is an abstract class. It is shown in Italics.
- Shape is a superclass. Circle, Rectangle and Polygon are derived from Shape. In other words, a Circle is-a Shape. This is a generalization / inheritance relationship.
- There is an association between DialogBox and DataController.
- Shape is part-of Window. This is an aggregation relationship. Shape can exist without Window.
- Point is part-of Circle. This is a composition relationship. Point cannot exist without a Circle.
- Window is dependent on Event. However, Event is not dependent on Window.
- The attributes of Circle are radius and center. This is an entity class.
- The method names of Circle are area(), circum(), setCenter() and setRadius().
- The parameter radius in Circle is an in parameter of type float.
- The method area() of class Circle returns a value of type double.
- The attributes and method names of Rectangle are hidden. Some other classes in the diagram also have their attributes and method names hidden.
The second most popular type of diagram in UML is the Activity diagram:
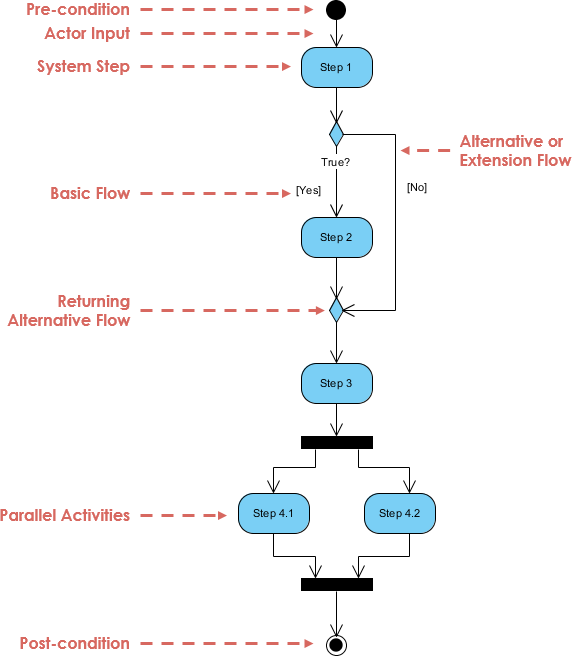
Activity Diagram
Activity diagram is another important behavioral diagram in UML diagram to describe dynamic aspects of the system. Activity diagram is essentially an advanced version of flow chart that modeling the flow from one activity to another activity.
When to Use Activity Diagram
Activity Diagrams describe how activities are coordinated to provide a service which can be at different levels of abstraction. Typically, an event needs to be achieved by some operations, particularly where the operation is intended to achieve a number of different things that require coordination, or how the events in a single use case relate to one another, in particular, use cases where activities may overlap and require coordination. It is also suitable for modeling how a collection of use cases coordinate to represent business workflows
- Identify candidate use cases, through the examination of business workflows
- Identify pre- and post-conditions (the context) for use cases
- Model workflows between/within use cases
- Model complex workflows in operations on objects
- Model in detail complex activities in a high level activity Diagram
Activity Diagram ? Learn by Examples
A basic activity diagram ? flowchart like
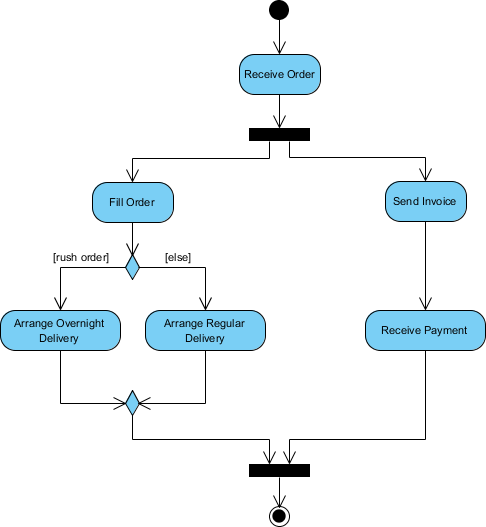
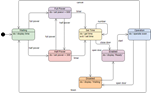
Activity Diagram Example ? Process Order
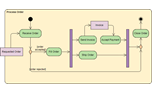
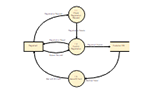
Given the problem description related to the workflow for processing an order, let?s model the description in visual representation using an activity diagram:
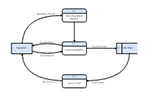
Process Order ? Problem Description
Once the order is received, the activities split into two parallel sets of activities. One side fills and sends the order while the other handles the billing.
On the Fill Order side, the method of delivery is decided conditionally. Depending on the condition either the Overnight Delivery activity or the Regular Delivery activity is performed.
Finally the parallel activities combine to close the order.
The activity diagram example below visualize the flow in graphical form.
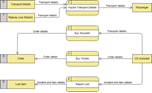
The third most widely used UML diagram type is the Sequence Diagram:
Sequence Diagram
UML Sequence Diagrams are interaction diagrams that detail how operations are carried out. They capture the interaction between objects in the context of a collaboration. Sequence Diagrams are time focus and they show the order of the interaction visually by using the vertical axis of the diagram to represent time what messages are sent and when.
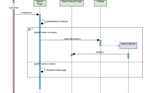
Sequence Diagram Example: Hotel System
Sequence Diagram is an interaction diagram that details how operations are carried out ? what messages are sent and when. Sequence diagrams are organized according to time. The time progresses as you go down the page. The objects involved in the operation are listed from left to right according to when they take part in the message sequence.
Below is a sequence diagram for making a hotel reservation. The object initiating the sequence of messages is a Reservation window.
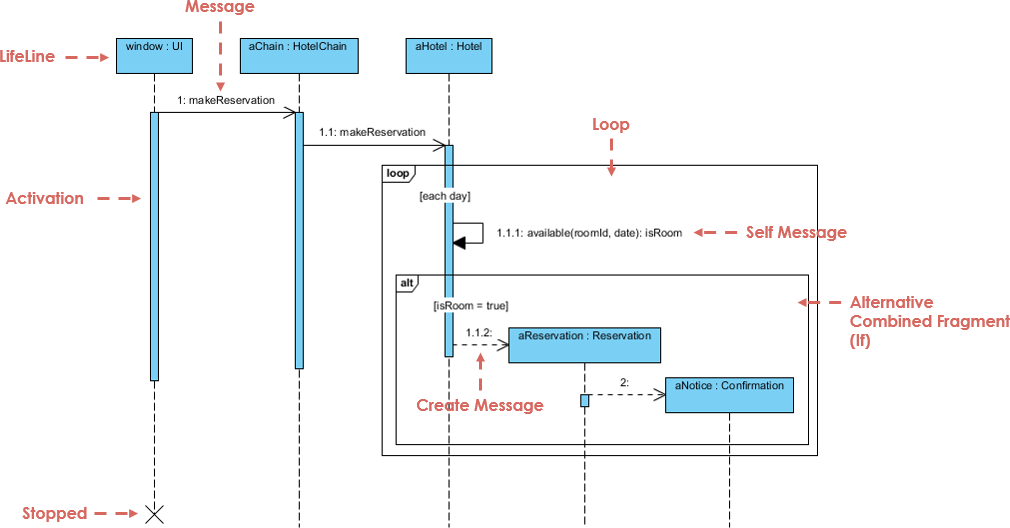
Note That: Class and object diagrams are static model views. Interaction diagrams are dynamic. They describe how objects collaborate.
The fourth most widely-used types of UML Diagram (96%) are:
- use case diagram
- state machine diagram
Use Case Diagram
A UML use case diagram is the primary form of system/software requirements for a new software program underdeveloped. Use cases specify the expected behavior (what), and not the exact method of making it happen (how).
Use cases once specified can be denoted both textual and visual representation (i.e. use case diagram). A key concept of use case modeling is that it helps us design a system from the end user?s perspective. It is an effective technique for communicating system behavior in the user?s terms by specifying all externally visible system behavior.
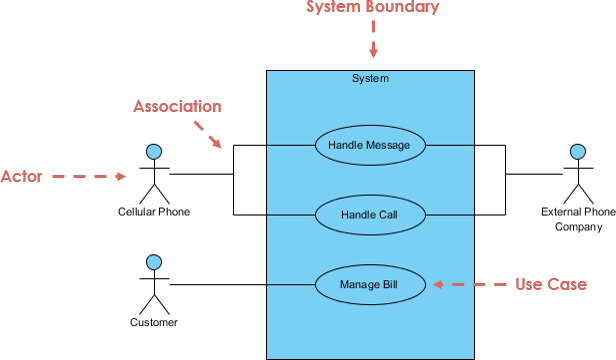
Use Case Diagram at a Glance
A standard form of use case diagram is defined in the Unified Modeling Language as shown in the Use Case Diagram example below:
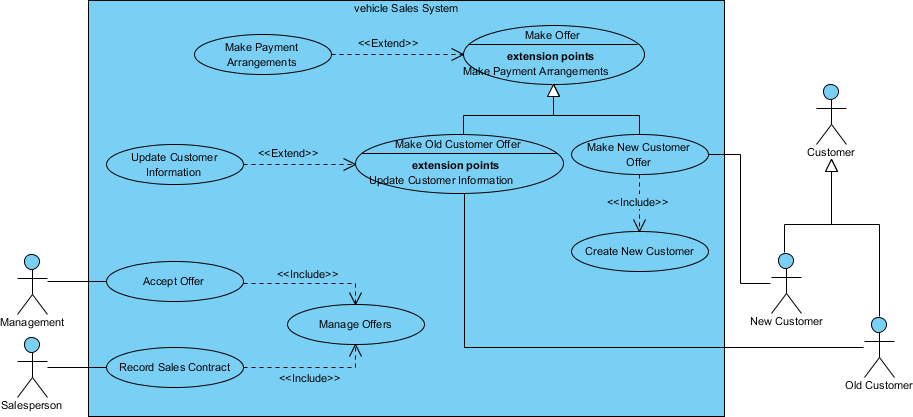
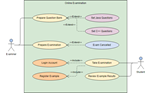
Use Case Diagram ? Vehicle Sales Systems
The figure below shows a use case diagram example for a vehicle system. As you can see even a system as big as a vehicle sales system contains not more than 10 use cases! That?s the beauty of use case modeling.
The use case model also shows the use of extend and include. Besides, there are associations that connect between actors and use cases.
State Diagram
The behavior of an entity is not only a direct consequence of its inputs, but it also depends on its preceding state. The past history of an entity can best be modeled by a finite state machine diagram or traditionally called automata.
UML State Machine Diagrams (or sometimes referred to as state diagram, state machine or state chart) show the different states of an entity. State machine diagrams can also show how an entity responds to various events by changing from one state to another. State machine diagram is a UML diagram used to model the dynamic nature of a system.
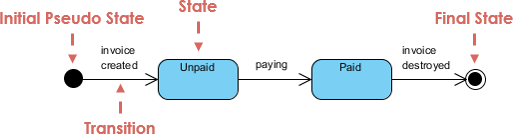
Simple State Machine Diagram Notation
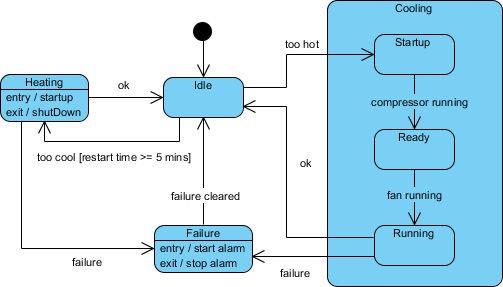
A simple state is one which has no substructure. A state which has substates (nested states) is called a composite state. Substates may be nested to any level. A nested state machine may have at most one initial state and one final state. Substates are used to simplify complex flat state machines by showing that some states are only possible within a particular context (the enclosing state).
Substate Example ? Heater
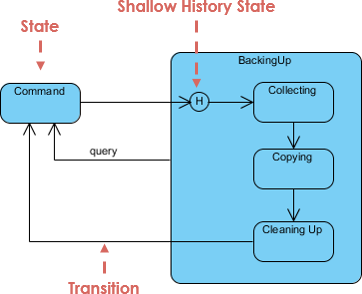
History States
Unless otherwise specified, when a transition enters a composite state, the action of the nested state machine starts over again at the initial state (unless the transition targets a substate directly). History states allow the state machine to re-enter the last substate that was active prior to leaving the composite state. An example of history state usage is presented in the figure below.
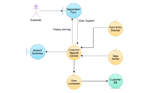
The usage of Communication Diagram is 82% according to the survey:
Communication Diagram
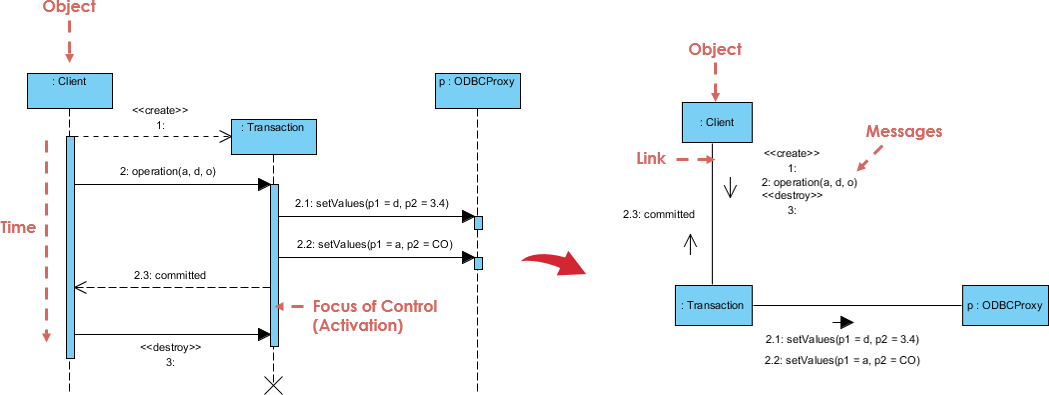
UML communication diagrams, like the sequence diagrams ? a kind of interaction diagram, shows how objects interact. A communication diagram is an extension of object diagram that shows the objects along with the messages that travel from one to another. In addition to the associations among objects, communication diagram shows the messages the objects send each other.
Communication Diagram at a Glance
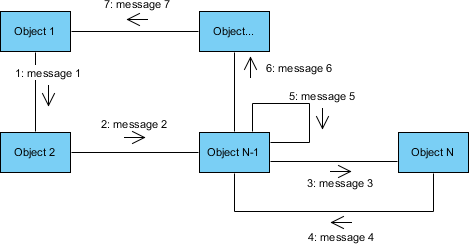
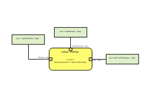
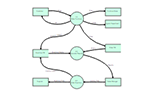
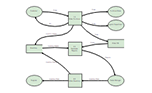
In the example of the notation for a communication diagram, objects (actors in use cases) are represented by rectangles. In the example (generic communication diagram):
- The objects are Object1, Object2, Object?, ObjectN-1 ?, and ObjectN.
- Messages passed between objects are represented by labeled arrows that start with the sending object (actor) and end with the receiving object.
- The sample messages passed between objects are labeled 1: message1, 2: message2, 3: message3, etc., where the numerical prefix to the message name indicates its order in the sequence.
- Object1 first sends Object2 the message message1, Object2 in turn sends ObjectN-1 the message message2, and so on.
- Messages that objects send to themselves are indicated as loops (e.g., message message5).
Communication Diagram vs Sequence Diagram
The communication diagram and the sequence diagram are similar. They?re semantically equivalent, that is, the present the same information, and you can turn a communication to a sequence diagram and vice versa. The main distinction between them is that the communication diagram arranged elements according to space, the sequence diagram is according to time.
Of the two types of interaction diagrams, sequence diagrams seem to be used far more than communication diagrams. So, why would you use communication diagrams? First of all, they are very useful for visualizing the relationship between objects collaborating to perform a particular task. This is difficult to determine from a sequence diagram. In addition, communication diagrams can also help you determine the accuracy of your static model (i.e., class diagrams).
Both Component Diagram and Deployment diagram usages are 80%:
Component Diagram
UML Component diagrams are used in modeling the physical aspects of object-oriented systems that are used for visualizing, specifying, and documenting component-based systems and also for constructing executable systems through forward and reverse engineering.
Component diagrams are essentially class diagrams that focus on a system?s components that often used to model the static implementation view of a system.
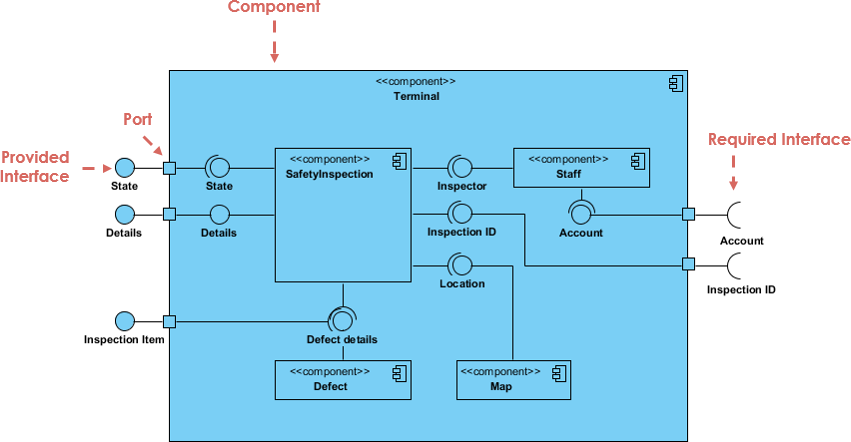
Component Diagram at a Glance
A component diagram breaks down the actual system under development into various high levels of functionality. Each component is responsible for one clear aim within the entire system and only interacts with other essential elements on a need-to-know basis.
Deployment Diagram
A UML deployment diagram is a diagram that shows the configuration of run time processing nodes and the components that live on them. Deployment diagrams is a kind of structure diagram used in modeling the physical aspects of an object-oriented system. They are often be used to model the static deployment view of a system (topology of the hardware).
Deployment Diagram at a Glance
Deployment diagrams are important for visualizing, specifying, and documenting embedded, client/server, and distributed systems and also for managing executable systems through forward and reverse engineering.
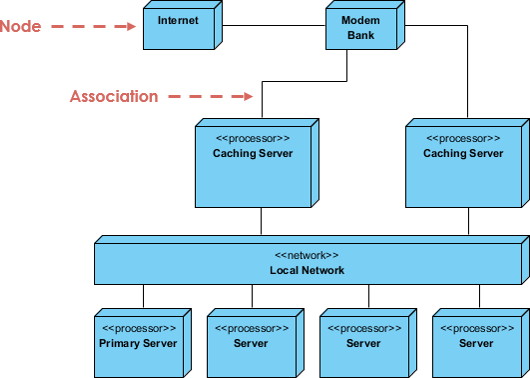
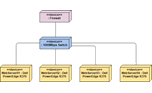
A deployment diagram is just a special kind of class diagram, which focuses on a system?s nodes. Graphically, a deployment diagram is a collection of vertices and arcs. Deployment diagrams commonly contain:
Nodes
- 3-D box represents a node, either software or hardware
- HW node can be signified with <<stereotype>>
- Connections between nodes are represented with a line, with optional <<stereotype>>
- Nodes can reside within a node
Other Notations
- Dependency
- Association relationships.
- May also contain notes and constraints.
The usage for UML object diagram is 71% according to the survey:
Object Diagram
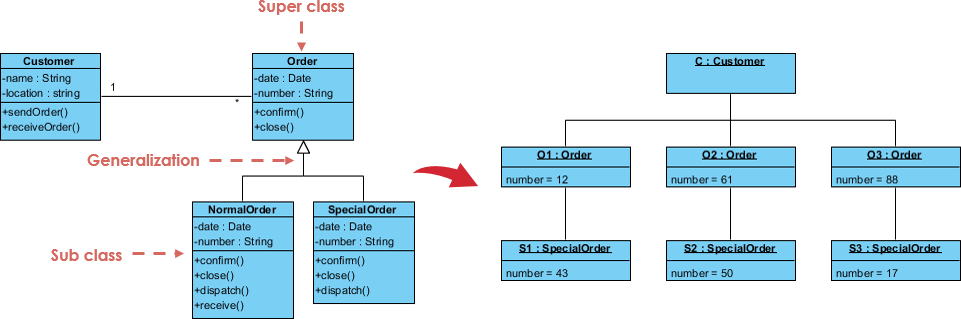
Object is an instance of a particular moment in runtime, including objects and data values. A static UML object diagram is an instance of a class diagram; it shows a snapshot of the detailed state of a system at a point in time, thus an object diagram encompasses objects and their relationships at a point in time.
Object Diagram at a Glance
An object diagram shows this relation between the instantiated classes and the defined class, and the relation between these objects in the system. They are be useful to explain smaller portions of your system, when your system class diagram is very complex, and also sometimes modeling recursive relationship in diagram.
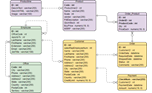
The best way to illustrate what an object diagram look like is to show the object diagram derived from the corresponding class diagram.
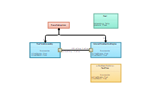
The following Order Management System shows their relationships. This small class diagram shows that a university Department can contain lots of other Departments and the object diagram below instantiates the class diagram, replacing it by a concrete example.
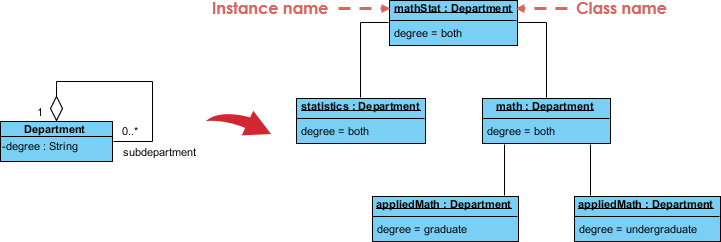
Class to Object Diagram Example ? Order System
The usage of package diagram is 70%:
Package Diagram
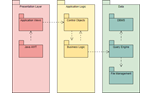
Package diagram, a kind of structural diagram, shows the arrangement and organization of model elements in middle to large scale project. Package diagram can show both structure and dependencies between sub-systems or modules, showing different views of a system, for example, as multi-layered (aka multi-tiered) application ? multi-layered application model.
Package Diagram at a Glance
Package diagram is used to simplify complex class diagrams, you can group classes into packages. A package is a collection of logically related UML elements.
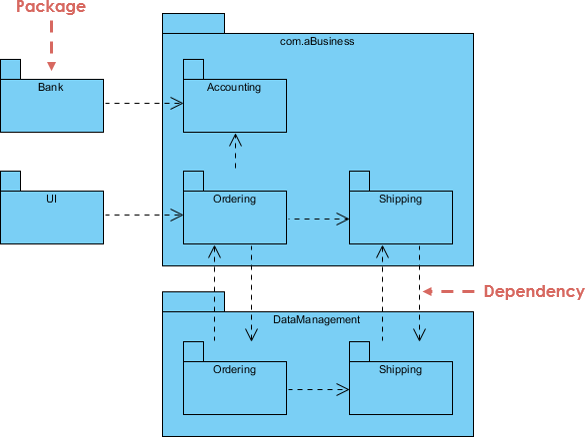
The diagram below is a business model in which the classes are grouped into packages:
- Packages appear as rectangles with small tabs at the top.
- The package name is on the tab or inside the rectangle.
- The dotted arrows are dependencies.
- One package depends on another if changes in the other could possibly force changes in the first.
Composite structure diagram?s usage is 52%:
Composite Structure Diagram
Composite Structure Diagram is one of the new artifacts added to UML 2.0. A composite structure diagram is a UML structural diagram that contains classes, interfaces, packages, and their relationships, and that provides a logical view of all, or part of a software system. It shows the internal structure (including parts and connectors) of a structured classifier or collaboration.
A composite structure diagram performs a similar role to a class diagram, but allows you to go into further detail in describing the internal structure of multiple classes and showing the interactions between them. You can graphically represent inner classes and parts and show associations both between and within classes.
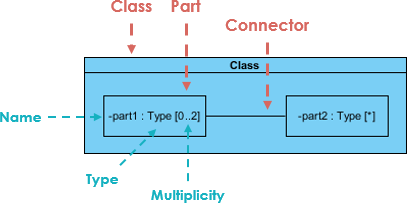
Composite Structure Diagram at a Glance
- Composite Structure Diagrams show the internal parts of a class.
- Parts are named: partName:partType[multiplicity]
- Aggregated classes are parts of a class but parts are not necessarily classes, a part is any element that is used to make up the containing class.
Timing Diagram has only 40% usage and rarely used by average users
Timing Diagram
Timing diagrams are UML interaction diagrams used to show interactions when a primary purpose of the diagram is to reason about time. They focus on conditions changing within and among lifelines along a linear time axis. Timing Diagrams describe behavior of both individual classifiers and interactions of classifiers, focusing attention on time of occurrence of events causing changes in the modeled conditions of the Lifelines.
Time Diagram at a Glance
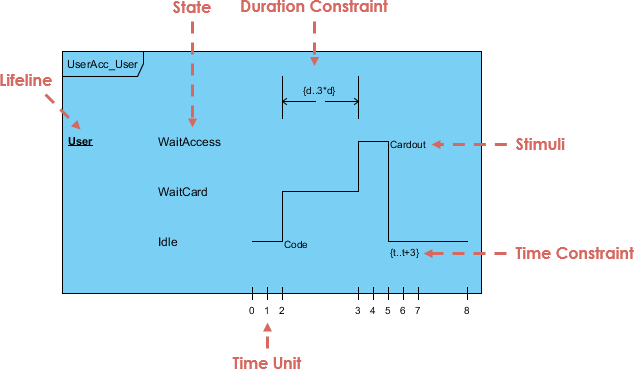
State Timeline Representation
Changes from one state to another are represented by a change in the level of the lifeline. For the period of time when the object is a given state, the timeline runs parallel to that state. A change in state appears as a vertical change from one level to another. The cause of the change, as is the case in a state or sequence diagram, is the receipt of a message, an event that causes a change, a condition within the system, or even just the passage of time.
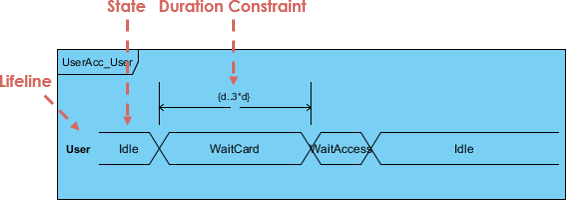
Value lifeline Representation
The figure below shows an alternative notation of UML Timing diagram. It shows the state of the object between two horizontal lines that cross with each other each time the state changes.
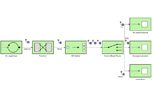
Interactive Overview Diagram is a new diagram added in UML 2.0:
Interactive Overview Diagram
UML Interaction Overview Diagrams provide a high level of abstraction an interaction model. It is a variant of the Activity Diagram where the nodes are the interactions or interaction occurrences.
The Interaction Overview Diagram focuses on the overview of the flow of control of the interactions which can also show the flow of activity between diagrams. In other words, you can link up the ?real? diagrams and achieve high degree navigability between diagrams inside an Interaction Overview Diagram.
Interaction Overview Diagram at a Glance
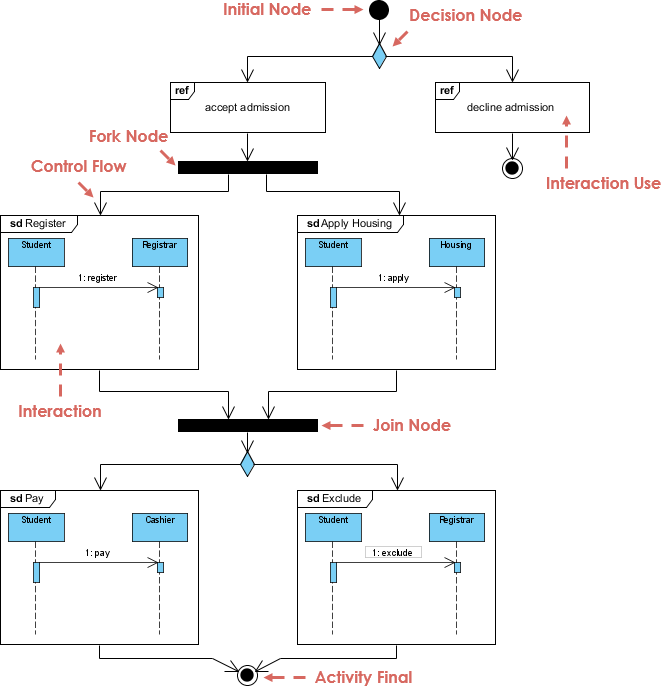
Interaction Overview Diagram is one of the fourteen types of diagrams of the Unified Modeling Language (UML), which can picture a control flow with nodes that can contain interaction diagrams which show how a set of fragments might be initiated in various scenarios. Interaction overview diagrams focus on the overview of the flow of control where the nodes are interactions (sd) or interaction use (ref).
The other notation elements for interaction overview diagrams are the same as for activity and sequence diagrams. These include initial, final, decision, merge, fork and join nodes.
The least usage UML diagram is the Profile Diagram, it got only 11%:
Profile Diagram
As a general purpose modeling language, UML provides a stable basis for a wide variety of requirements. It is not defined for specific application domains or for any specific technology. However, in some circumstances, UML is too general and using it involves a considerable amount of effort. In such cases, the use of a language optimized for the given domain and therefore offering special concepts is advantageous.
Profile diagram, a kind of structural diagram in the Unified Modeling Language (UML), provides a generic extension mechanism for customizing UML models for particular domains and platforms. Extension mechanisms allow refining standard semantics in strictly additive manner, preventing them from contradicting standard semantics. Profiles are defined using stereotypes, tagged value definitions, and constraints which are applied to specific model elements, like Classes, Attributes, Operations, and Activities. A Profile is a collection of such extensions that collectively customize UML for a particular domain (e.g., aerospace, healthcare, financial) or platform (J2EE, .NET).
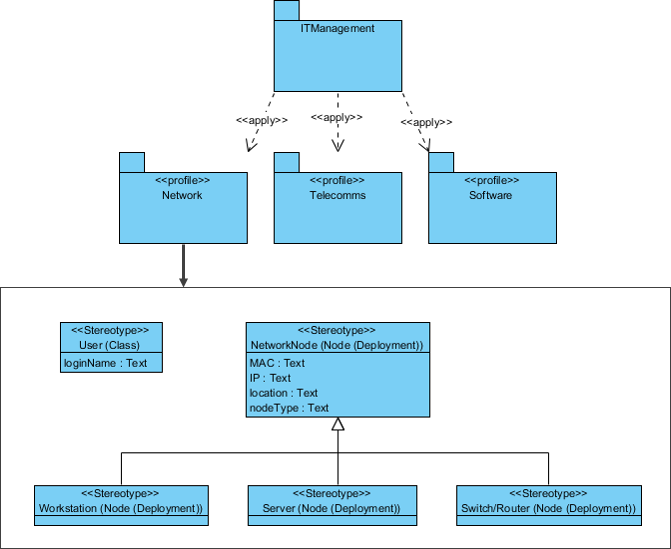
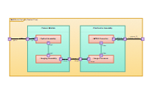
Profile Diagram Example ? IT Management
A profile is applied to another package in order to make the stereotypes in the profile available to that package. The illustration below shows the Network, Telecomms and Software profiles being applied to the ITManagement package.
Looking for Free Online Software Design Tool?
Here is Visual Paradigm Online repository for software design examples, it is:
- Free (personal and non-commercial purpose)
- Online (zero installation, and configuration)
- Support Google Drive and free cloud storage
- A lot of examples
- Use it anytime & anywhere! only need a web browser
Use Case Diagram
Class Diagram
Activity Diagram

Component Diagram
Deployment Diagram
Package Diagram
State Machine Diagram
Sequence Diagram
ER Diagram
Data Flow Diagram
Robustness Diagram
Enterprise Int. Ptrns
Requirement Diagram
Block Definition Diagram
Parametric Diagram
Internal Block Diagram
Gane Sarson Diagram
Yourdon and Coad
Yourdon DeMarco DFD
SSADM DFD

