The Data Flow Diagram (DFD) is a structured analysis and design method. It is traditional visual representation of the information flows within a system. Data Flow Diagram(DFD) is widely used for software analysis and design. A neat and clear DFD can depict a good amount of the system requirements graphically.
The Data Flow Diagram (DFD) depicts the logic models and expresses data transformation in a system. It includes a mechanism to model the data flow and supports decomposition to illustrate details of the data flows and functions. A Data Flow Diagram cannot present information on operation sequence. Therefore, it is not a process or procedure modeling method.
DFD includes following characteristics:
- supporting the analysis and requirement stage of system design;
- a diagramming technique with annotation;
- describing a network of activities/processes of the target system;
- allowing for behaviors of parallel and asynchronous ;
- stepwise refinement through hierarchical decomposition of processes.
Key Concepts of Data Flow Diagram
DFD presents a symbol system to describe data flows and a decomposition mechanism to describe a system at various detail levels.
Process
Now we?d like to briefly introduce to you a few diagram notations which you?ll see in the tutorial below.
External Entity
An external entity can represent a human, system or subsystem. It is where certain data comes from or goes to. It is external to the system we study, in terms of the business process. For this reason, people used to draw external entities on the edge of a diagram.
Process
A process is a business activity or function where the manipulation and transformation of data takes place. A process can be decomposed to finer level of details, for representing how data is being processed within the process.
Data Store
A data store represents the storage of persistent data required and/or produced by the process. Here are some examples of data stores: membership forms, database table, etc.
![]()
Data Flow
A data flow represents the flow of information, with its direction represented by an arrow head that shows at the end(s) of flow connector.
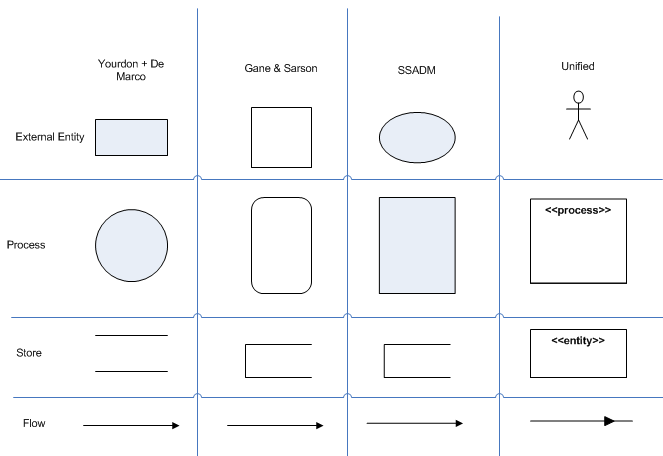
Different DFD Notations
There are several different notations:
- Yourdon and/or De Marco,
- Gane & Sarson,
- SSADM(Structured System Analysis and Design Methodology), and
- Unified Modeling Language have ways of showing data flows.
How to Draw DFD with Multiple Context Levels?
Functional Decomposition is the process of taking a complex process and breaking it down into its smaller and simpler parts. Each of which can be broken down further. Once you?ve reached the lowest level of decomposed pieces of a subsystem, developers can think about how to start coding those functions. As you are working on the simplest functionality the developer can possibly work with the target system under developed. Therefore developing and testing those functionalities becomes much easier.
Created by: Visual Paradigm Enterprise, Professional, Standard, Modeler
Creating Context Level DFD
Context level DFD, also known as level 0 DFD, sees the whole system as a single process and emphasis the interaction between the system and external entities. Let?s draw a context DFD.
- To create a DFD, select Diagram > New from the toolbar.
- In the New Diagram window, select Data Flow Diagram and click Next.
- Enter Context Diagram as diagram name and click OK to confirm.
- Name the diagram Context Diagram.
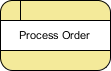
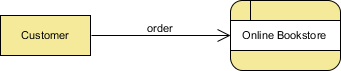
- We need to create the main process. Drag Process from diagram toolbar to diagram. Name it Online Bookstore. We will use online bookstore as an example to show you how to create multiple levels DFD.
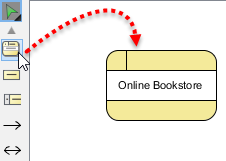
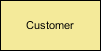
- As you can imagine, customers will be ordering books through the system. Therefore, add an External Entity to diagram and name it Customer. Like creating process, you can create an external entity by dragging External Entity from diagram toolbar to diagram.
![]()
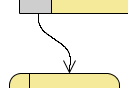
- A data flow is used to represent the movement of data between different parts of the system. In this case, ?order? is a data created by customer and submitted into the system. Therefore, create a data flow from Customer to Online Bookstore. To do this, move the mouse pointer over Customer. Drag out the Resource Catalog button.
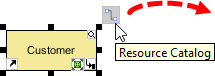
- Release the mouse button on Online Bookstore and select Data Flow from Resource Catalog. This creates a data flow connector.
- Name it order.
- The book store will finally deliver the books to the customer. Make use of the Resource Catalog to create a data flow from Online Bookstore to Customer. Name the flow ordered books.
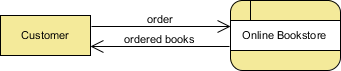
- That?s all for the context diagram. As we see the entire system as a single process, there is just one process shape created in this DFD level. In the next section you will decompose the Online Bookstore process and draw its detail.
Creating Level 1 DFD
In this section, you are going to draw the level 1 DFD to show the main functions of online bookstore.
- Right click on Online Bookstore and select Decompose from the popup menu.
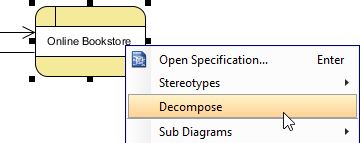
2. The data stores and/or external entities connected to the selected process would be referred to in the level 1 DFD. So when you are prompted to add them to the new diagram, click Yes to confirm. Note that the new DFD should look very similar to the context diagram initially. Every element should remain unchanged, except that the main process (from which this new DFD decomposes) is now gone and replaced by a blank space (to be elaborated).
3. Right click on the background of diagram and select Rename? from the popup menu. Name the diagram Level 1 DFD.
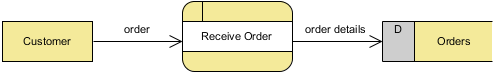
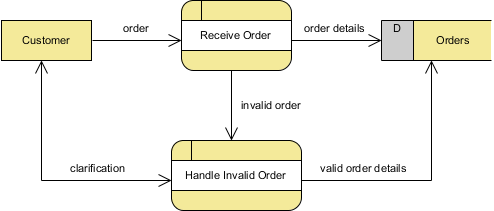
4. There is a process that receives customer order and store it into a database. Let?s create a process Receive Order and a data store Orders. Add data flows in between.
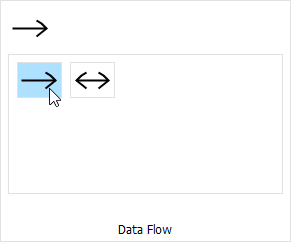
5. When an order is invalid, there should be another process that involves contacting the customer and clarifying his/her need. Create a process Handle Invalid Order. Add suitable data flows between the shapes. Here you may use a bi-directional data flow to represent the a dialog flow.
6. There is another process that handles shipment. Create the Ship Order process. Again, add appropriate data flows between the shapes.
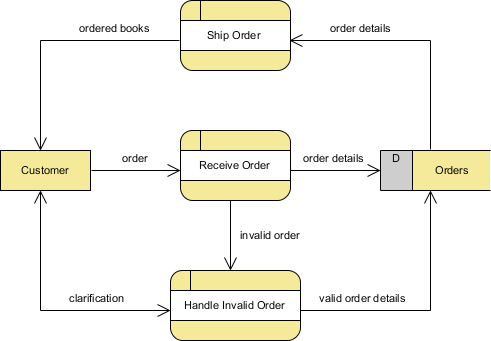
That?s all for this tutorial. Depending on the area of interest, you may create further levels to show the system in more detail. As you can imagine, the Ship Order process can be elaborated into smaller functional units (processes) like packaging, prepare invoice, arrange deliver, etc.
Try it Yourself with Visual Paradigm Online
- Free Data Flow Diagram examples and templates editable in an online Data Flow Diagram software: Visual Paradigm Online.
- Use the templates as a starting point to create your own Data Flow Diagram.
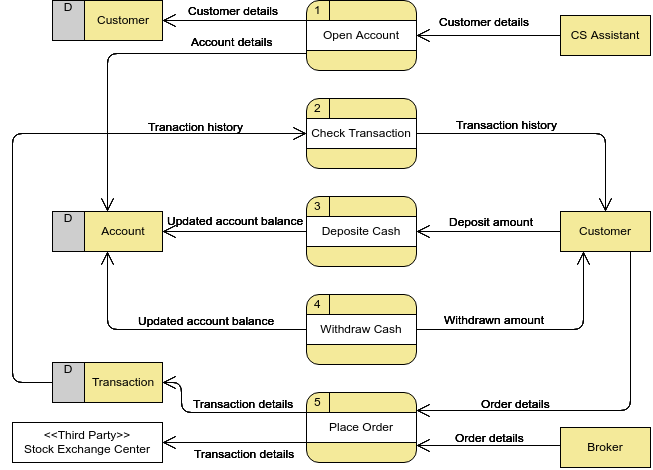
Securities Trading Platform
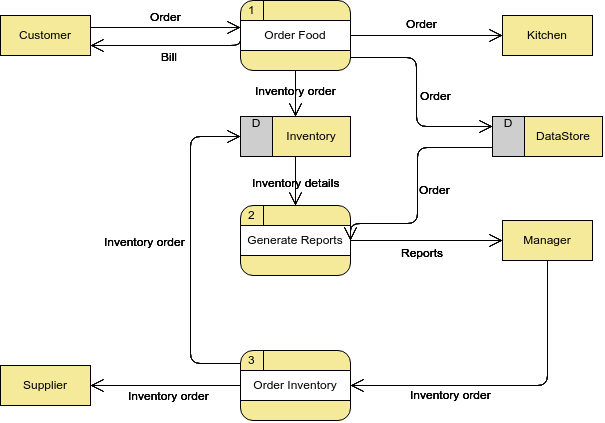
Food Ordering System
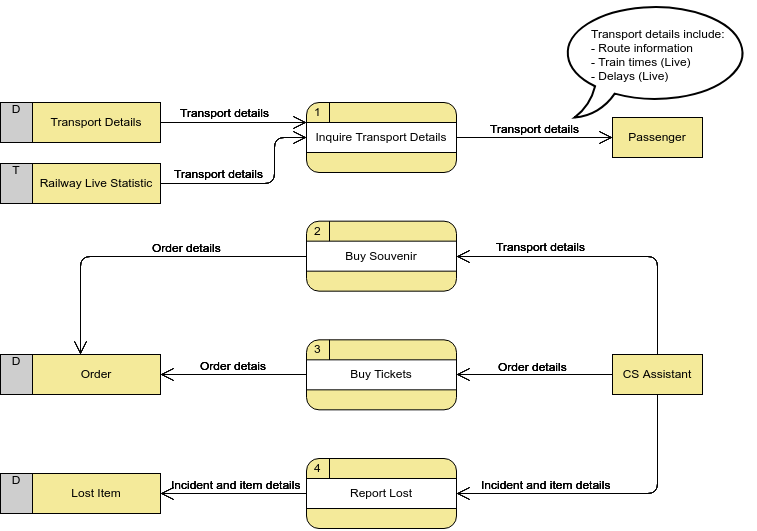
Customer Service System (Railway Company)
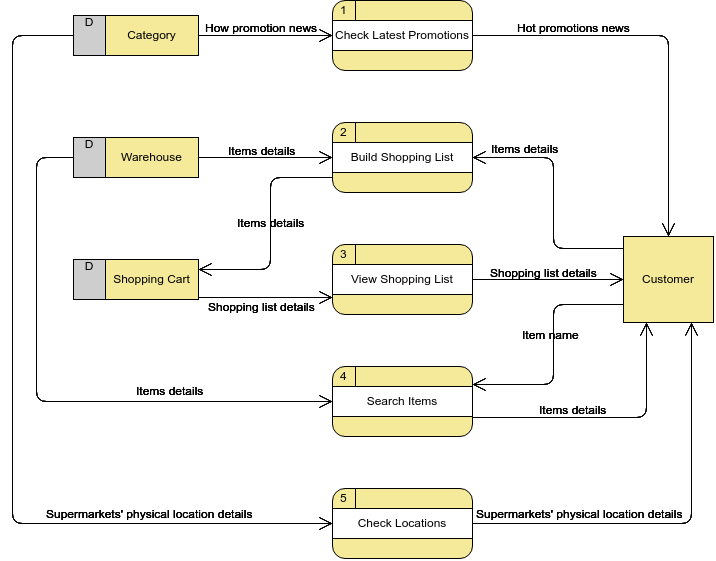
Supermarket App
Other Recommended DFD Articles
- What is Data Flow Diagram (DFD)? How to Draw DFD?
- How to Write Effective Use Cases?
- Data Flow Diagram: Examples ? Food Ordering System
- How to Model Relational Database Design with ERD?
- How to Develop As-Is and To-Be Business Process?

