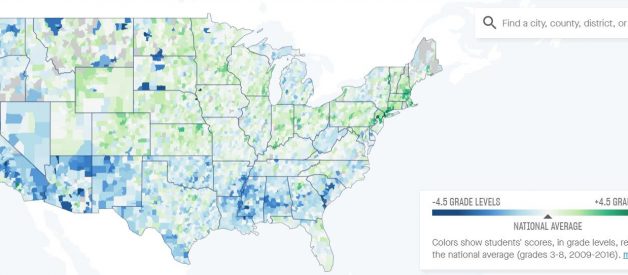
The Stanford Educational Data Archive gathered test scores from every county and school district in the country. Here?s a map of test scores across the whole country:
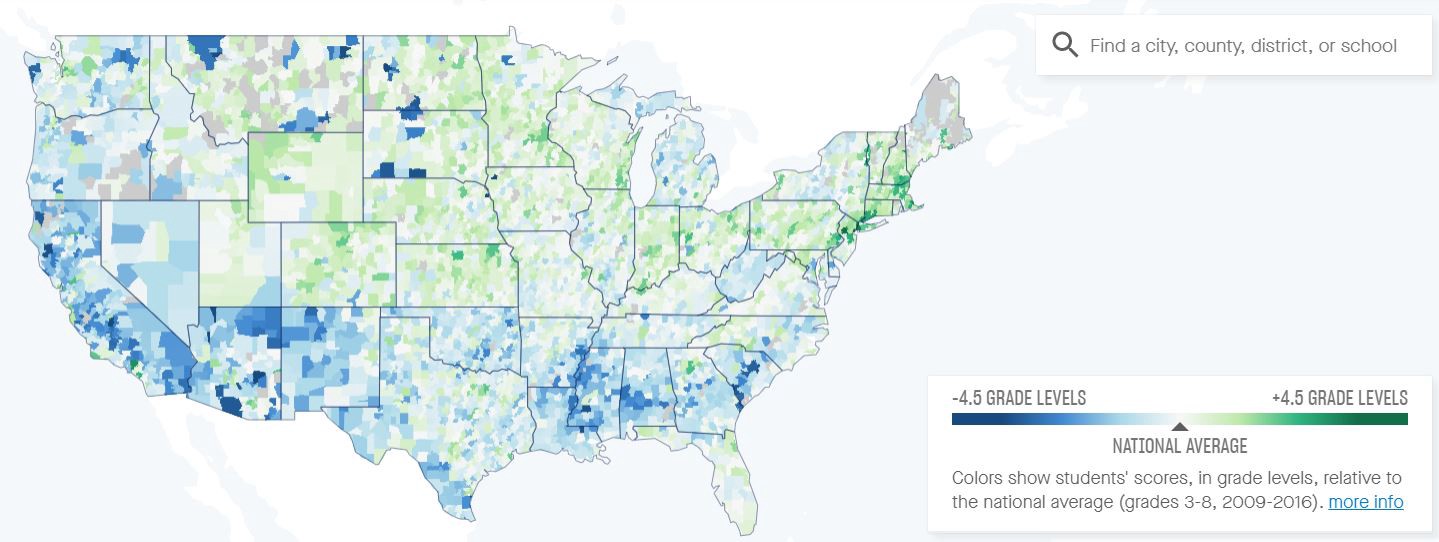
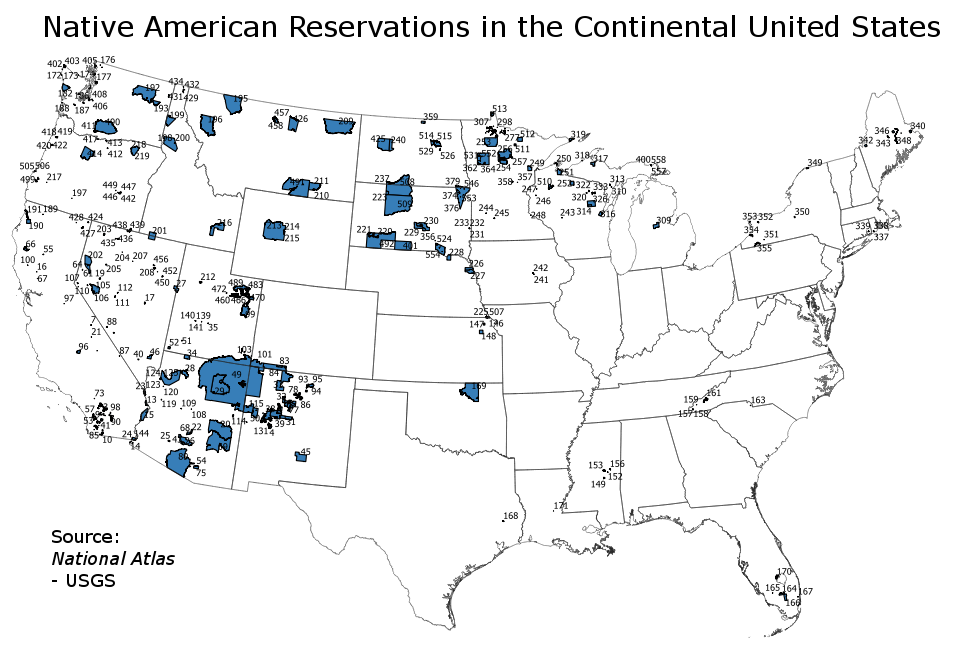
A few obvious features show up here. We can see a few places that get much lower test scores. Many Indian reservations show up: Standing Rock and Pine Ridge in South Dakota, the Navajo reservation at the four corners, and the Tohono O?odham nation in Southern Arizona.
We can also see the ?black belt? that goes up the Mississippi river and then straight across to Georgia. This shows the legacy of slavery in the south, counties here had the most slaves and are still majority black (this feature tends to show up in many maps of America, like in voting patterns or in TV shows people watch).
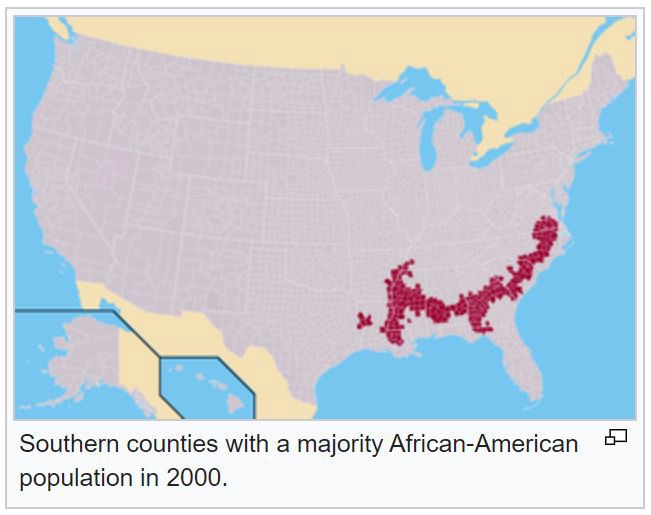
Okay, no surprises there ? black and native Americans have been struggling for centuries. Racial gaps in America are large. If we want to say anything about politics, we need to factors these out. Let?s map only white students:
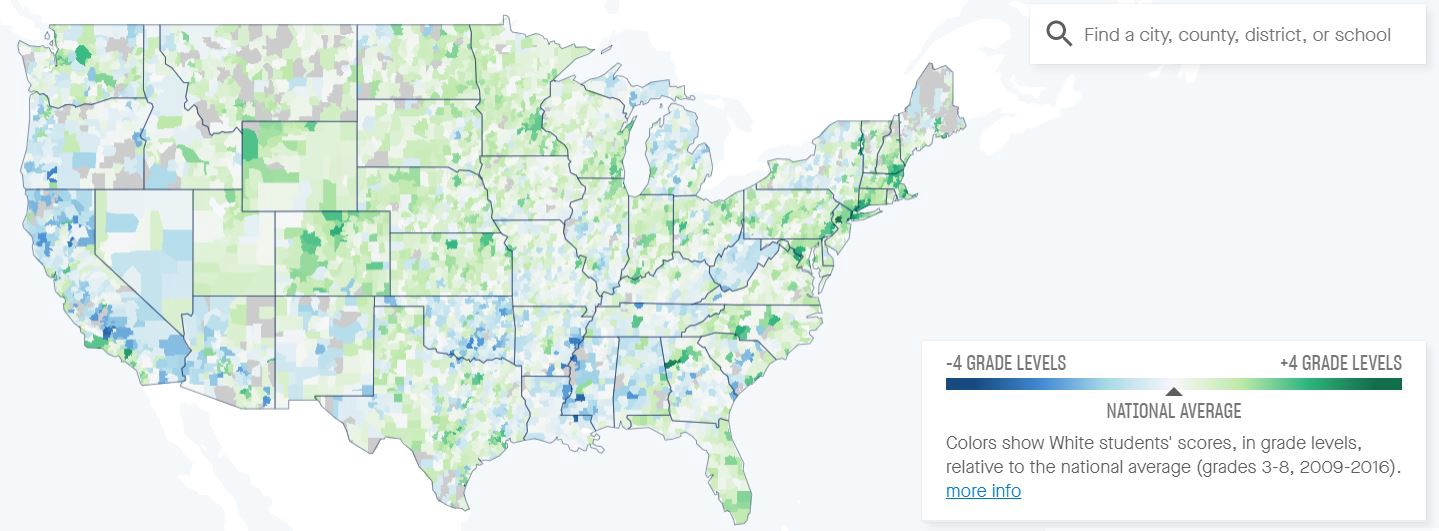
The gaps aren?t as obvious now. West Virginia does the worst. The middle of the country, from Utah to Minnesota, does fairly well. We can calculate an average IQ for each state:

We have to zoom in to see the biggest differences. Let?s look at California:
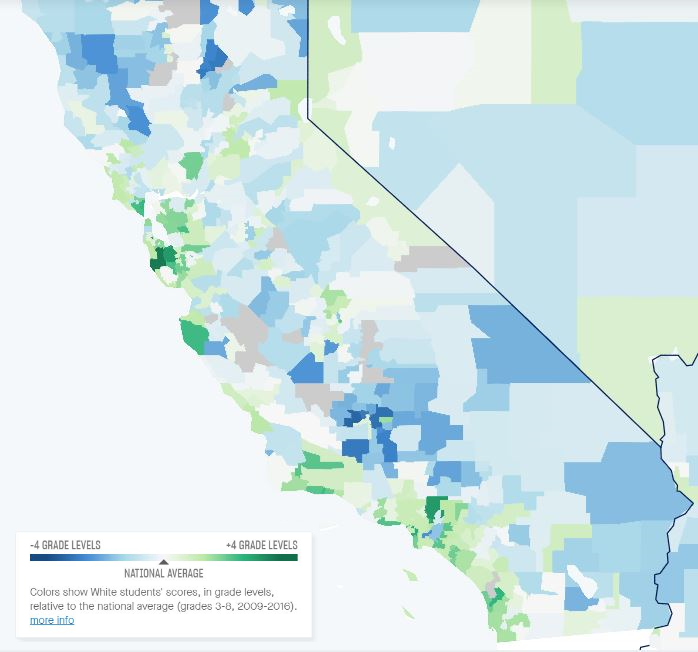
The bay area is doing well, as is coastal southern California. Further inland, it?s a different story.
Looking even closer at the bay area, we see big differences from one town to another:
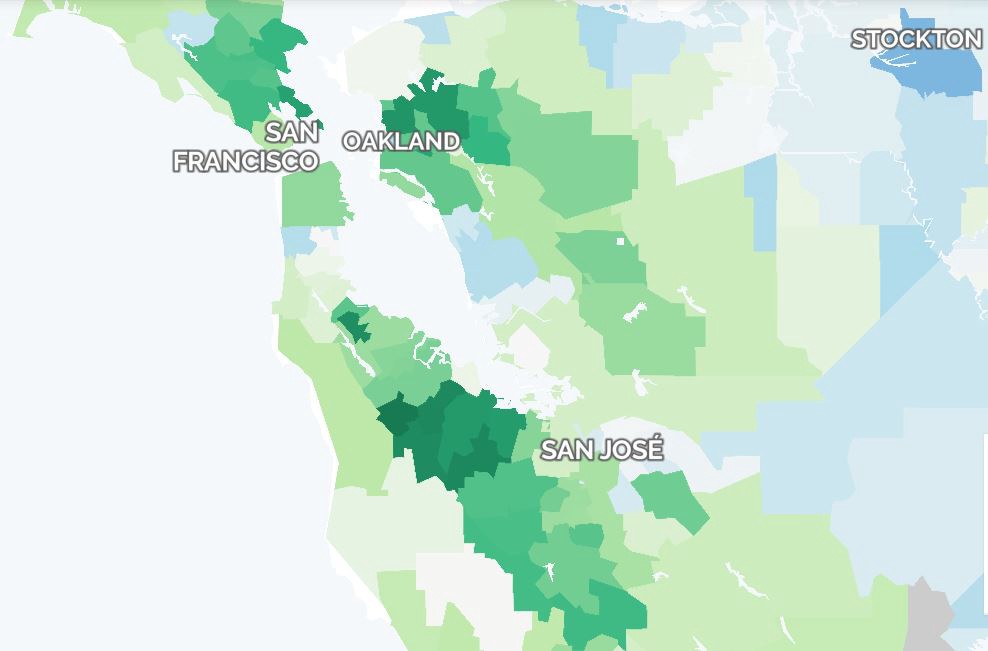
White kids in San Francisco are 1.5 grade levels ahead of the national average. Near all the big silicon valley tech companies (in places like Mountain View, Los Altos, or Woodside), white kids score the best ? a full 3 grade levels ahead (this equates to an average IQ of 115).
Kids in the more rural central valley aren?t doing as well, scoring at or below grade level. Kids in Stockton are 1.7 grade levels behind (IQ of 91).
It?s the same pattern in most states:
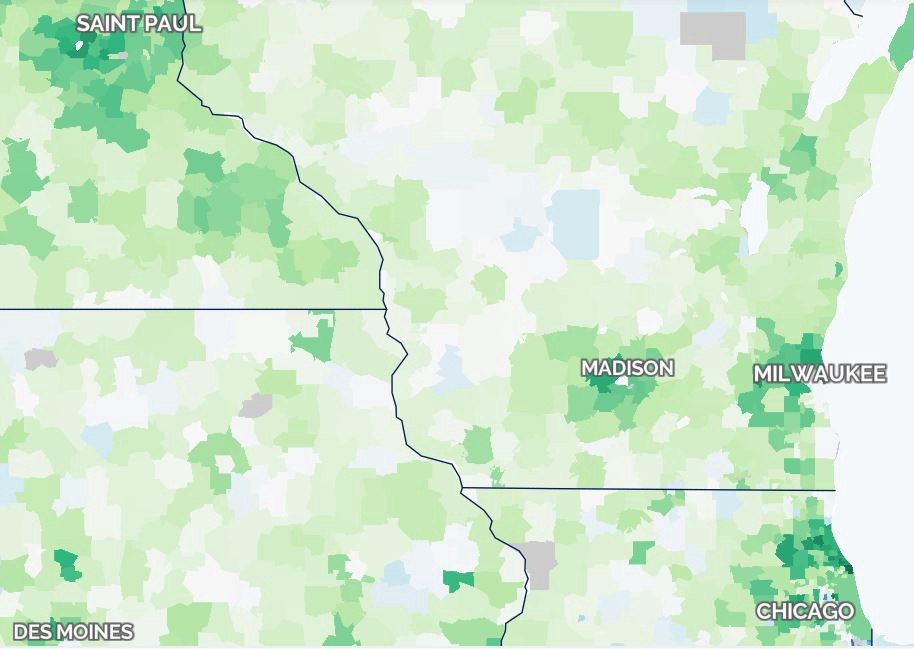
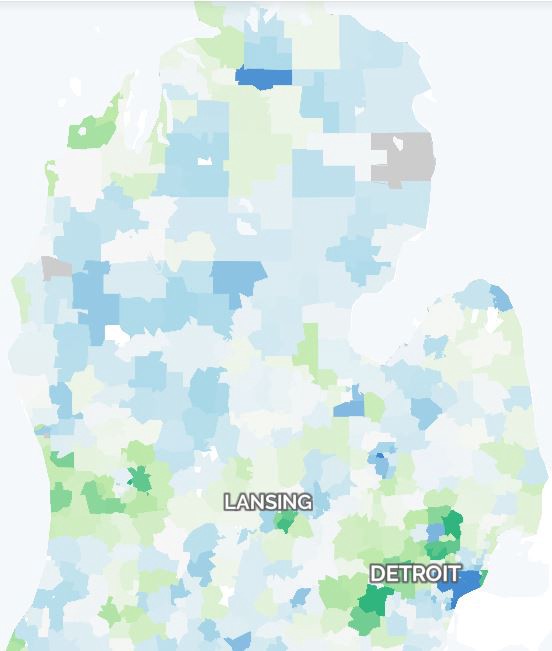
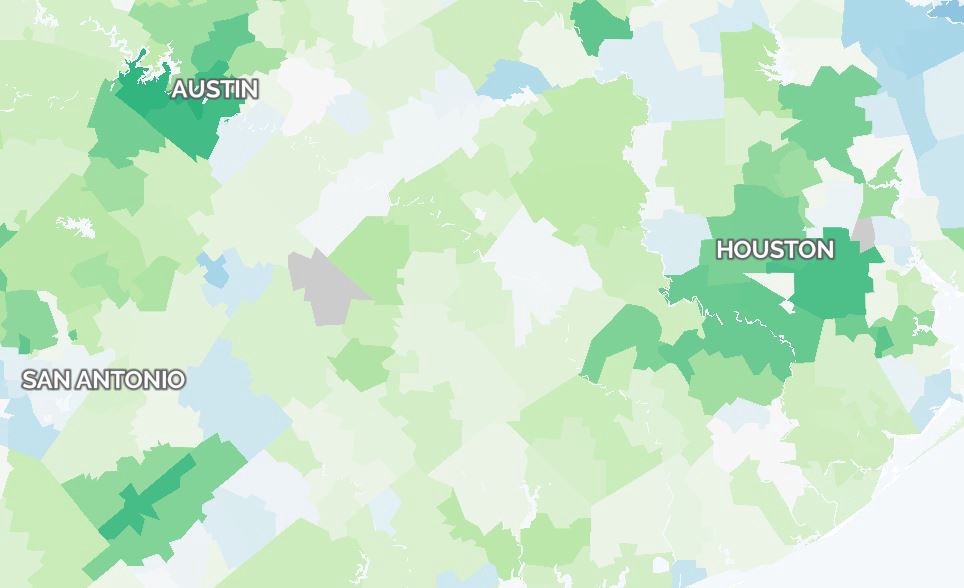
Kids in Ann Arbor or Lansing Michigan are 2 grades ahead of average. St Paul, Madison, Milwaukee, and Chicago all outscore rural areas by 2?3 grade levels. The only big city I see that bucks the trend and performs worse than average is Detroit.
So it seems like the general picture in America is one of smart kids in big cities, surrounded by less successful kids in the countryside.
This reminded me of the voting map for 2016:
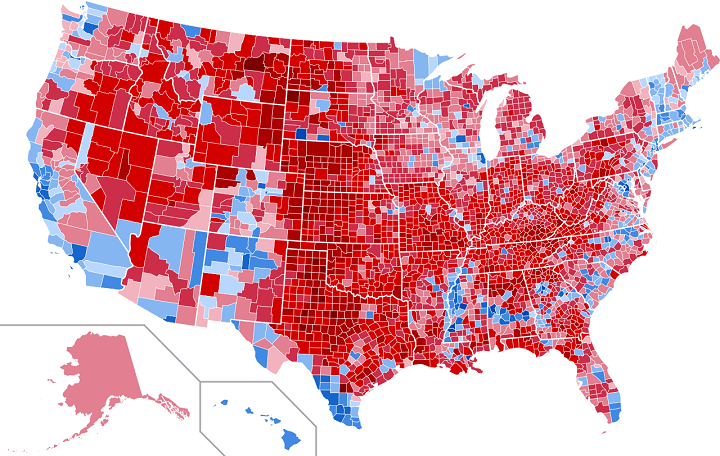 2016 presidential election voting map
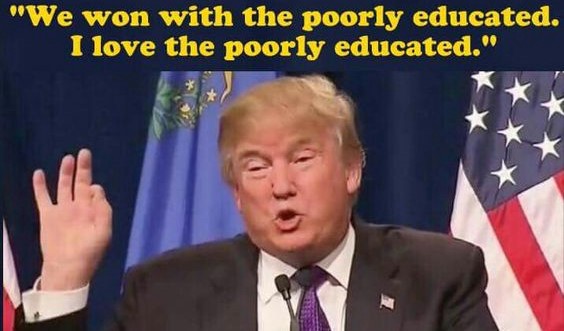
If rural areas vote for Trump and kids in rural areas have worse test scores, can we objectively say that Trump supporters are less intelligent?
I did the math. I downloaded voting data by county and 8th grade math scores by county, then wrote some code to match them against each other. We have to make a few assumptions here.
First, we?re looking at how adults voted and then how kids did on tests. So we?re assuming that kids are usually as smart as their parents.
Second, we?re assuming that NAEP math scores can be converted into IQ. If you look at sample questions, a lot of them are actually pattern matching puzzles, not math problems:
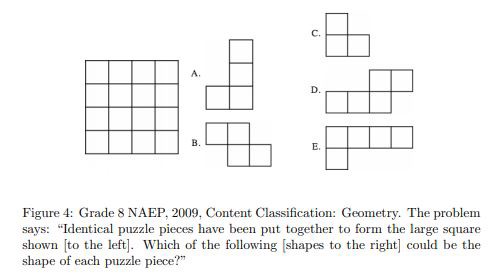
Third, we don?t know how to assign voters, for a mixed county. If the vote is 50/50, do we just assume that everyone is average and call half of them Republicans and half Democrats?
To make sense of this, I excluded counties that are close to even. Instead, I took all counties that split by 70/30 or more, and assigned those counties to the winning party. I averaged up the test scores separately for Republican and Democratic counties. For the 8th grade NAEP math test, we get an average score of 297 for Democrats and 283 for Republicans. The national average for white students is 291.5. Let?s convert that to IQ:
The average IQ for urban white Democrats is 102 and for rural white Republicans it?s 97.
That?s about a 1 grade level difference in performance (i.e. liberal 7th graders would score as well as conservative 8th graders on the test).
To double-check the results, I tried a few different thresholds. The answer comes out the same if I use only 75% or 80% polarized counties. If I use 85% or 90% polarized counties, the gap favoring Democrats grows to 8?10 IQ points.
Another way to double check this is to look at the 2016 exit polls. Two thirds of white voters without college degrees voted for Trump:
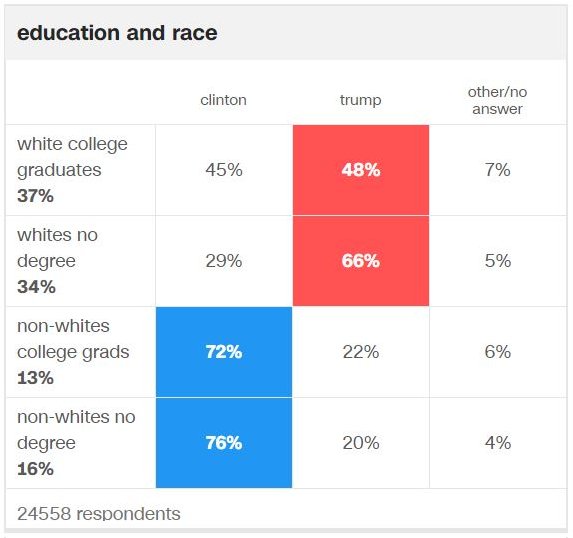
Let?s say the average college graduate has an IQ of 110 and the average high school graduate 95. We can get an IQ for each group:Clinton voters: (37*.45*110 + 34*.29*95) / (37*.45 + 34*.29) = 104.4Trump voters: (37*.48*110 + 34*.66*95) / (37*.48 + 34*.66 ) = 101.6
In summary:White Trump voters are less intelligent than Clinton voters. The average difference is maybe 3 to 5 IQ points. Trump voters aren?t all stupid, but there are more stupid Trump voters. Both parties have a spectrum of more and less intelligent people. White people are smarter in highly liberal counties than in very conservative areas, by about 5 IQ points. Kids in the most successful cities score 15 IQ points higher than average.
These results might make liberals feel smart and happy. But, before you start gloating, I think there are some things here that might make both sides unhappy.
No one agrees how much of intelligence is the result of good schools versus something innate. A lot of people on the right, and especially the alt-right, think that intelligence is genetic. They think that some minorities do worse on tests because those groups are genetically inferior. Well? by that same logic, conservatives are genetically inferior to liberals.
Most people on the left think that intelligence is a result of the environment. They think that some people do better in school because of privilege and others do worse because of oppression. If you think that?s the case, then you need to recognize that rural white Americans don?t have as much privilege as white, urban liberals. White kids in silicon valley have way more opportunities than white kids in West Virginia. If we want equality, then we need to start sharing wealth and privilege from a few rich cities into the rest of the country.
Read More:


